CNI Performance Benchmark
Introduction
This chapter contains performance benchmark numbers for a variety of scenarios. All tests are performed between containers running on two different bare metal nodes connected back-to-back by a 100Gbit/s network interface. Upon popular request we have included performance numbers for Calico for comparison.
Video
You can also watch Thomas Graf, Co-founder of Cilium, dive deep into this chapter in eCHO episode 5: Network performance benchmarking.
Tip
To achieve these performance results, follow the Tuning Guide.
For more information on the used system and configuration, see Test Hardware. For more details on all tested configurations, see Test Configurations.
The following metrics are collected and reported. Each metric represents a different traffic pattern that can be required for workloads. See the specific sections for an explanation on what type of workloads are represented by each benchmark.
- Throughput
Maximum transfer rate via a single TCP connection and the total transfer rate of 32 accumulated connections.
- Request/Response Rate
The number of request/response messages per second that can be transmitted over a single TCP connection and over 32 parallel TCP connections.
- Connections Rate
The number of connections per second that can be established in sequence with a single request/response payload message transmitted for each new connection. A single process and 32 parallel processes are tested.
For the various benchmarks netperf has been used to generate the workloads and to collect the metrics. For spawning parallel netperf sessions, super_netperf has been used. Both netperf and super_netperf are also frequently used and well established tools for benchmarking in the Linux kernel networking community.
TCP Throughput (TCP_STREAM)
Throughput testing (TCP_STREAM) is useful to understand the maximum throughput that can be achieved with a particular configuration. All or most configurations can achieve line-rate or close to line-rate if enough CPU resources are thrown at the load. It is therefore important to understand the amount of CPU resources required to achieve a certain throughput as these CPU resources will no longer be available to workloads running on the machine.
This test represents bulk data transfer workloads, e.g. streaming services or services performing data upload/download.
Single-Stream
In this test, a single TCP stream is opened between the containers and maximum throughput is achieved:
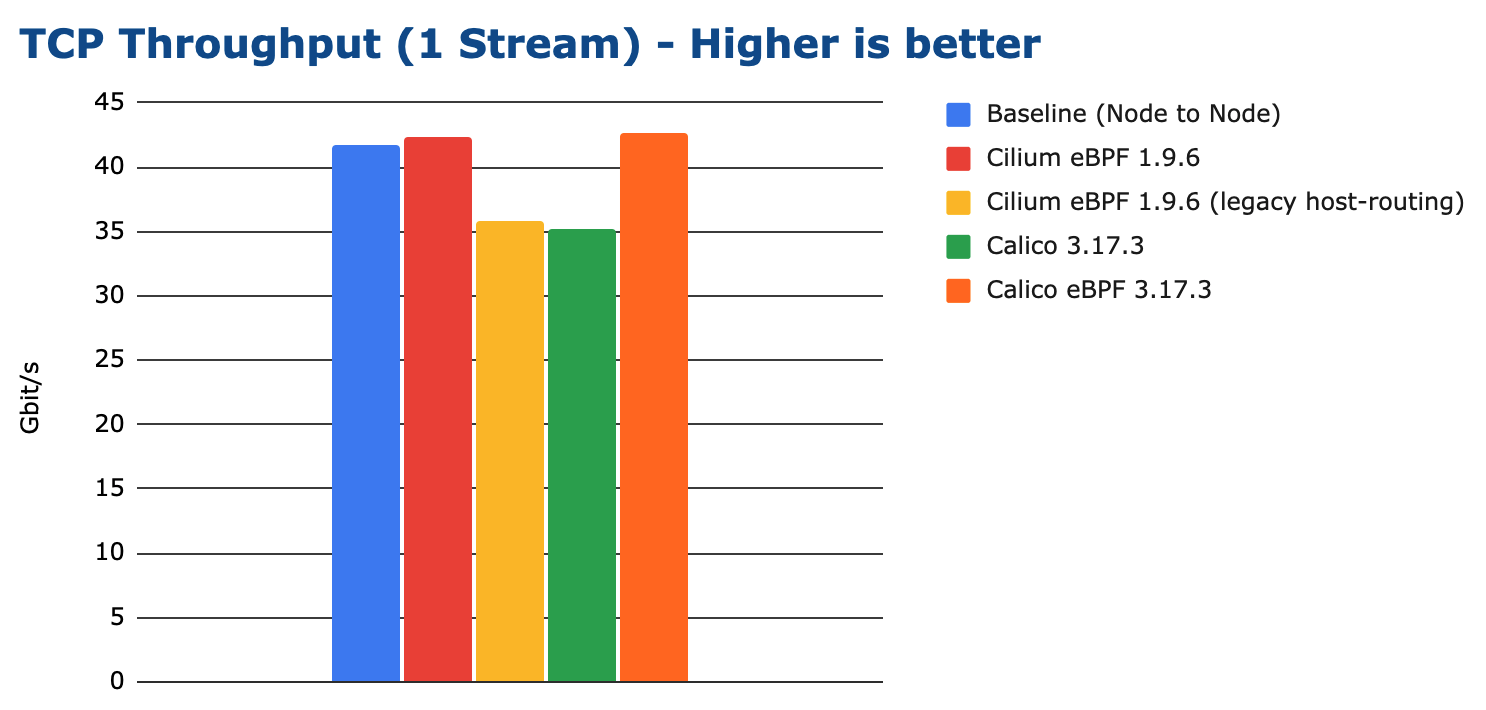
We can see that eBPF-based solutions can outperform even the node-to-node baseline on modern kernels despite performing additional work (forwarding into the network namespace of the container, policy enforcement, …). This is because eBPF is capable of bypassing the iptables layer of the node which is still traversed for the node to node baseline.
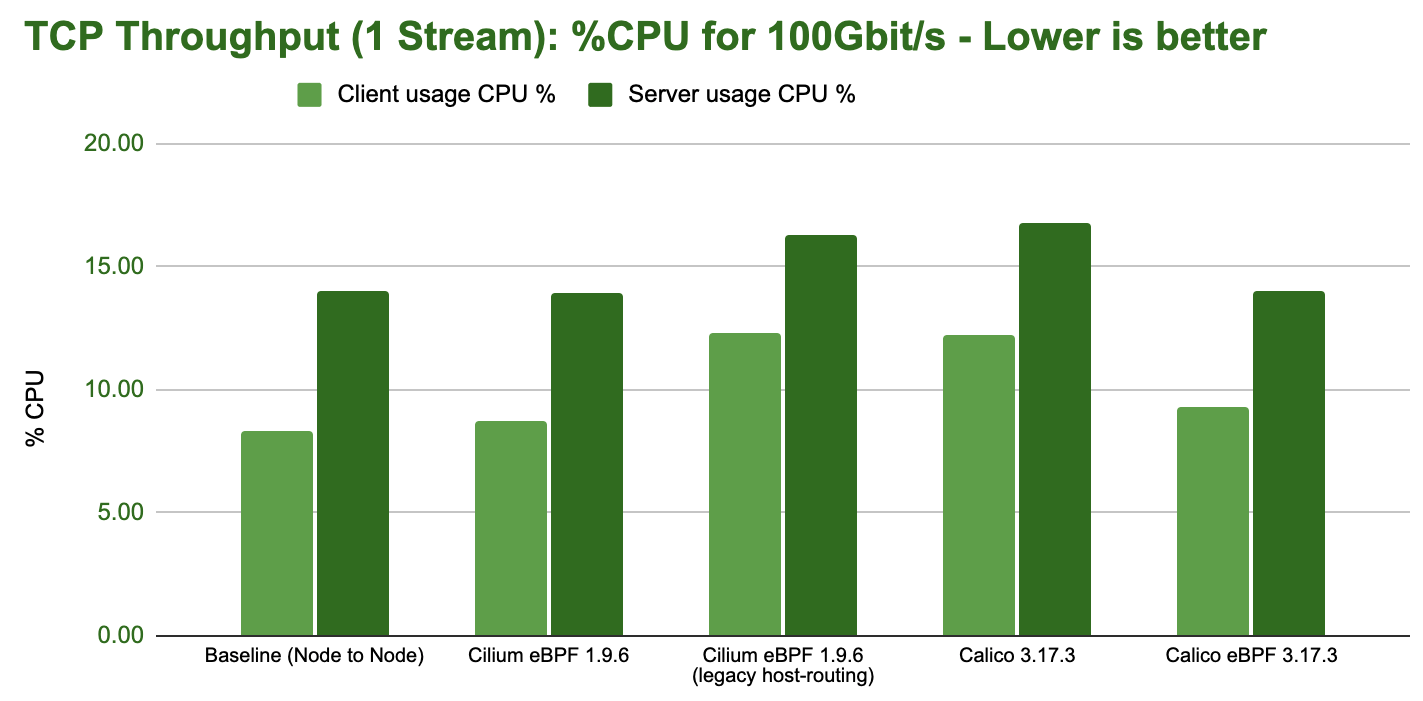
The following graph shows the total CPU consumption across the entire system while running the benchmark, normalized to a 50Gbit throughput:
Tip
Kernel wisdom: TCP flow performance is limited by the receiver, since sender can use both TSO super-packets. This can be observed in the increased CPU spending on the server-side above above.
Multi-Stream
In this test, 32 processes are opening 32 parallel TCP connections. Each process is attempting to reach maximum throughput and the total is reported:
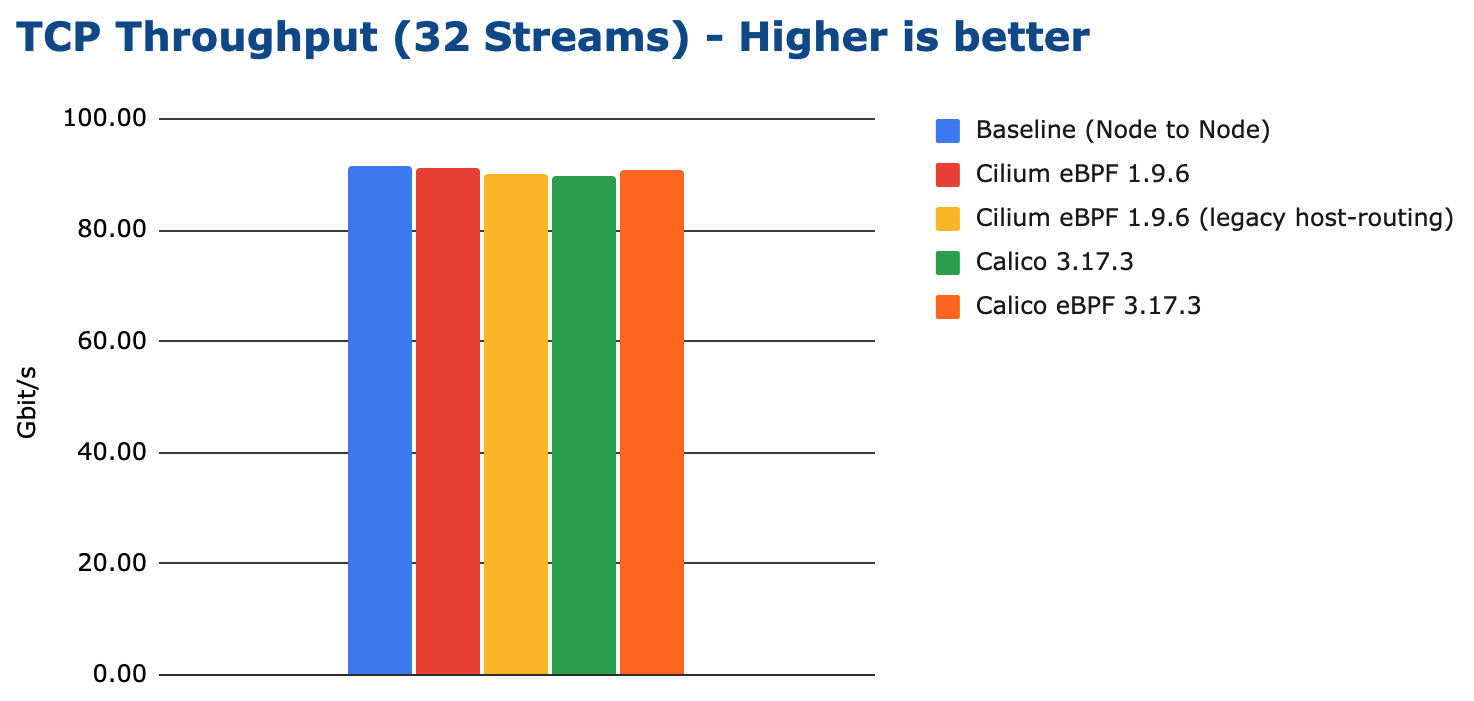
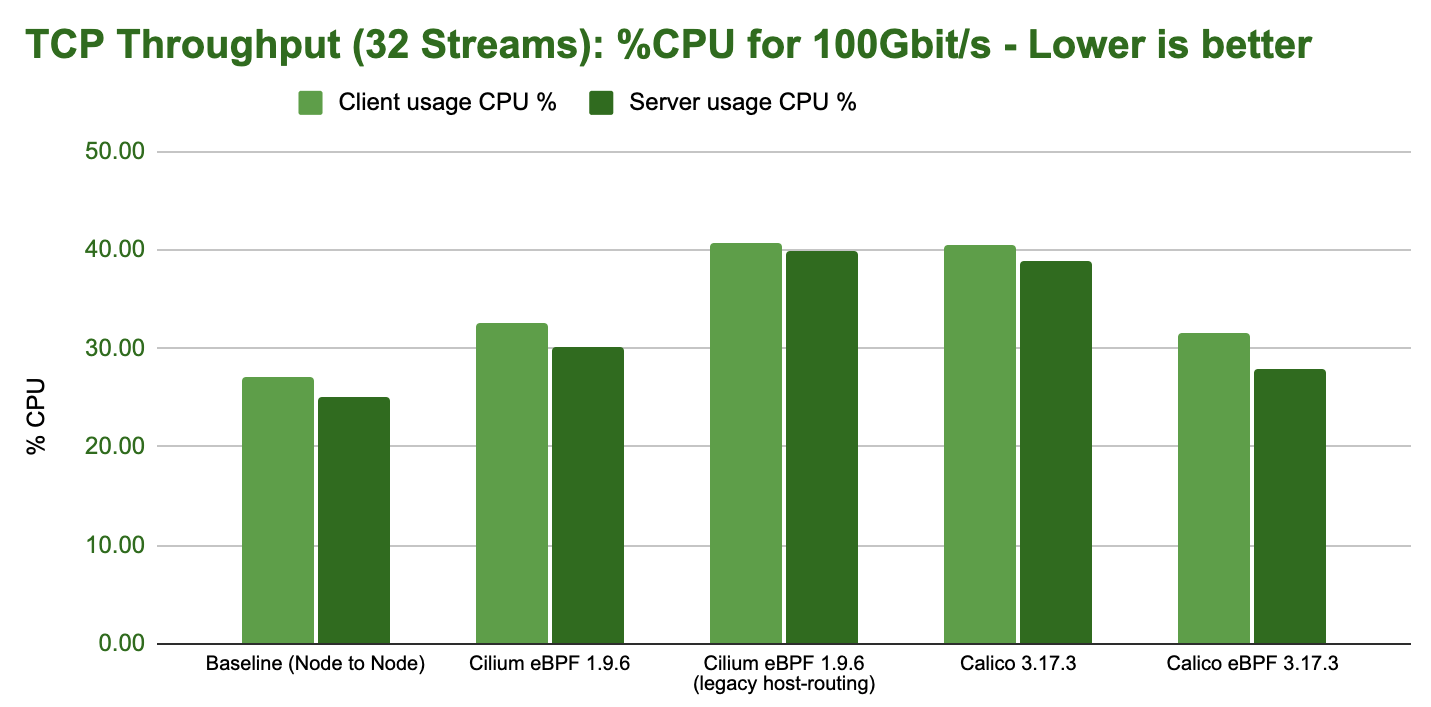
Given multiple processes are being used, all test configurations can achieve transfer rates close to the line-rate of the network interface. The main difference is the CPU resources required to achieve it:
Request/Response Rate (TCP_RR)
The request/response rate (TCP_RR) primarily measures the latency and efficiency to handle round-trip forwarding of an individual network packet. This benchmark will lead to the most packets per second possible on the wire and stresses the cost performed by a network packet. This is the opposite of the throughput test which maximizes the size of each network packet.
A configuration that is doing well in this test (delivering high requests per second rates) will also deliver better (lower) network latencies.
This test represents services which maintain persistent connections and exchange request/response type interactions with other services. This is common for services using REST or gRPC APIs.
1 Process
In this test, a single TCP connection is opened between the containers and a single byte is sent back and forth between the containers. For each round-trip, one request is counted:
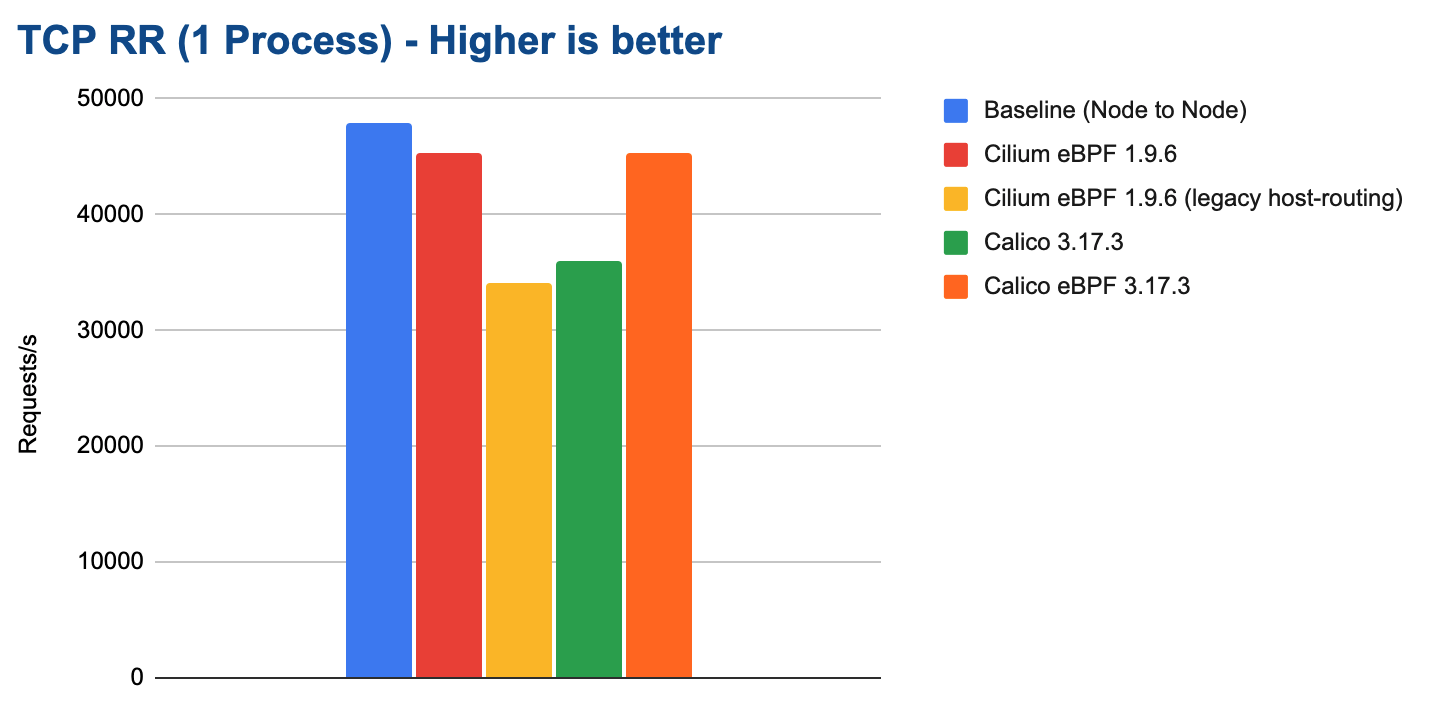
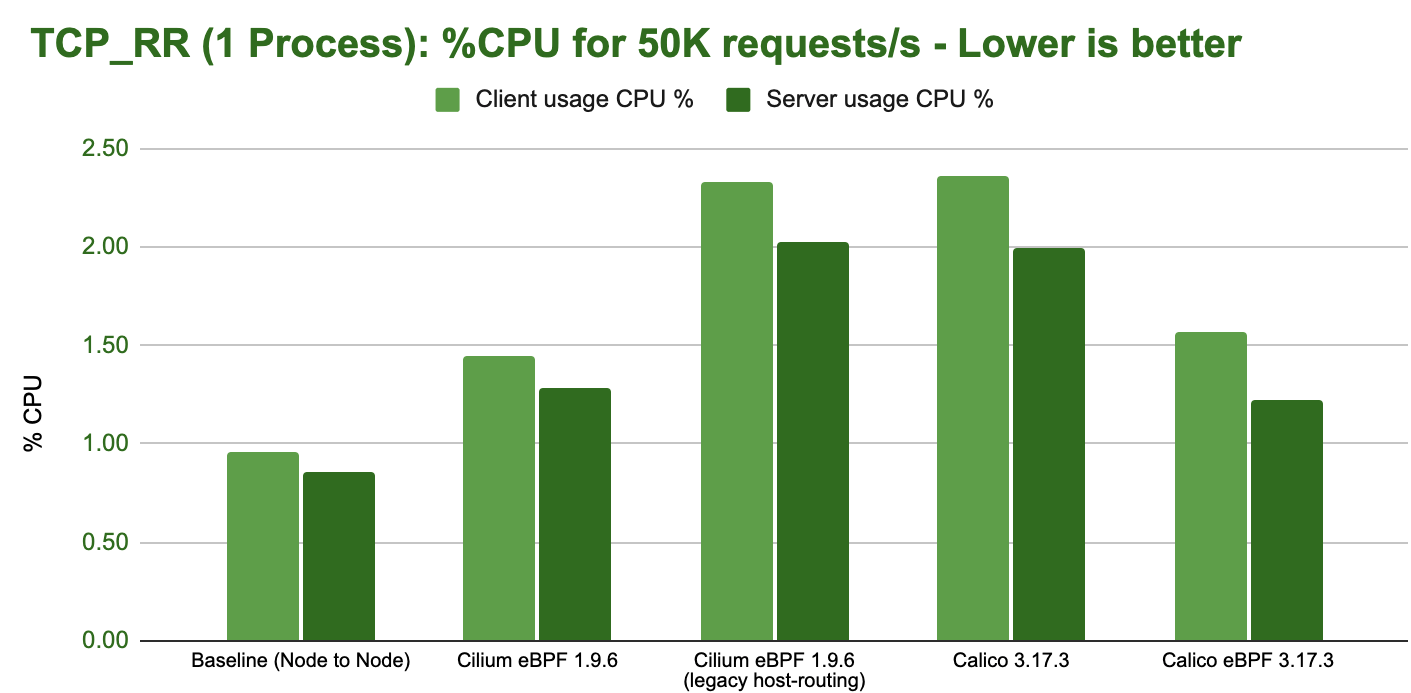
eBPF on modern kernels can achieve almost the same request/response rate as the baseline while only consuming marginally more CPU resources:
32 Processes
In this test, 32 processes are opening 32 parallel TCP connections. Each process is performing single byte round-trips. The total number of requests per second is reported:
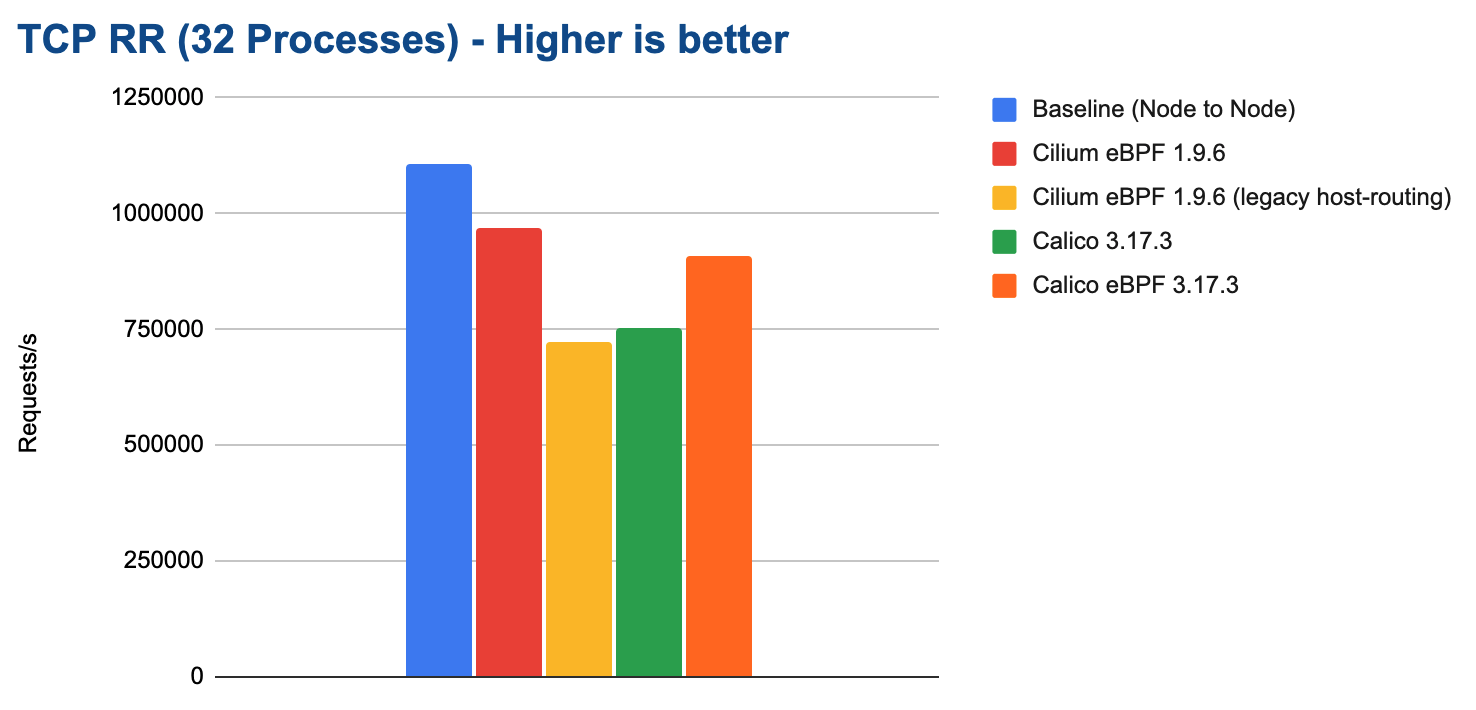
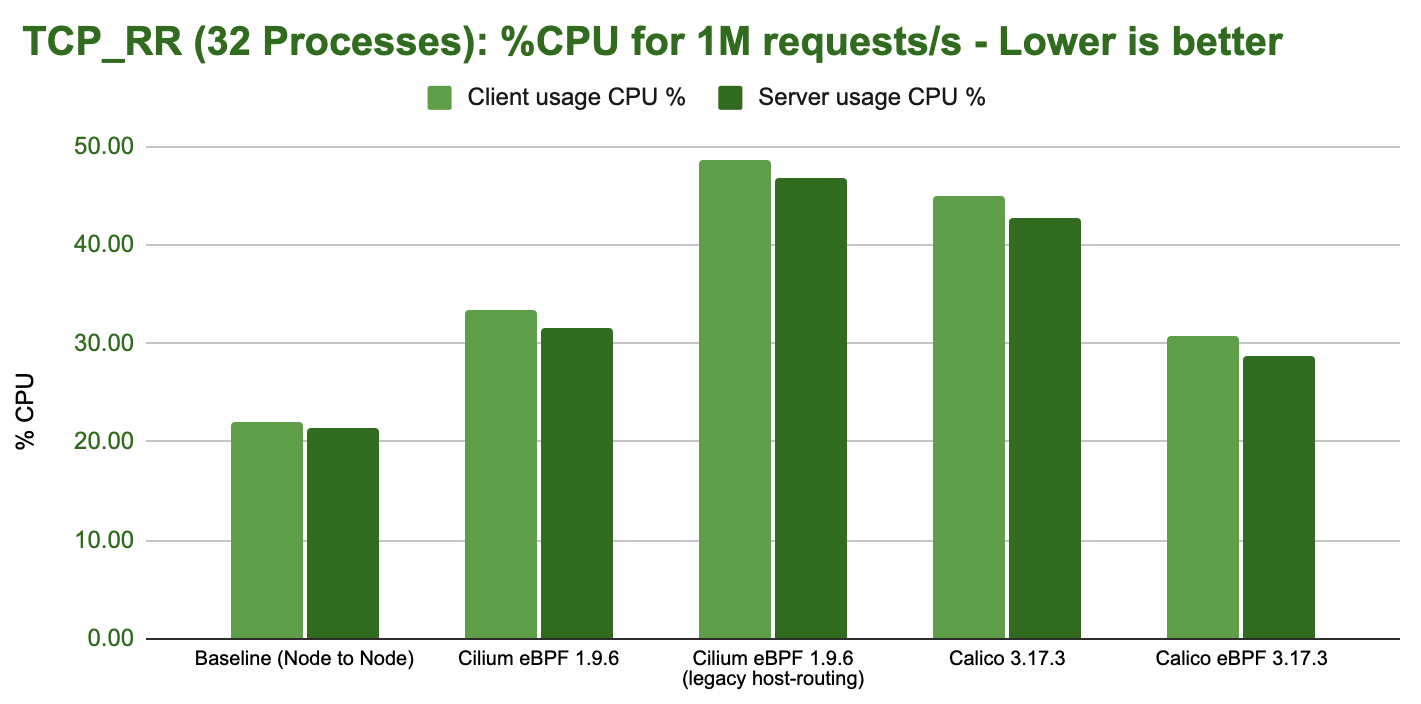
Cilium can achieve close to 1M requests/s in this test while consuming about 30% of the system resources on both the sender and receiver:
Connection Rate (TCP_CRR)
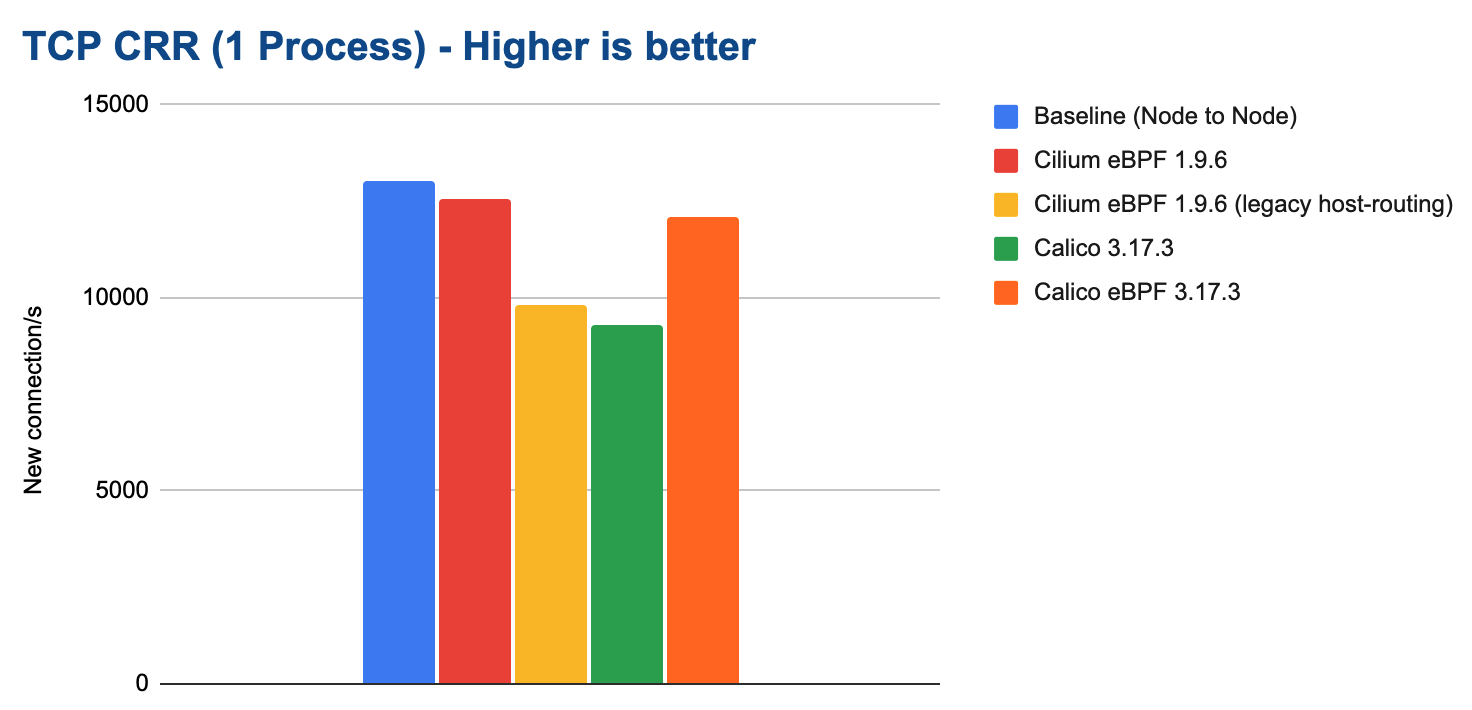
The connection rate (TCP_CRR) test measures the efficiency in handling new connections. It is similar to the request/response rate test but will create a new TCP connection for each round-trip. This measures the cost of establishing a connection, transmitting a byte in both directions, and closing the connection. This is more expensive than the TCP_RR test and puts stress on the cost related to handling new connections.
This test represents a workload that receives or initiates a lot of TCP connections. An example where this is the case is a publicly exposed service that receives connections from many clients. Good examples of this are L4 proxies or services opening many connections to external endpoints. This benchmark puts the most stress on the system with the least work offloaded to hardware so we can expect to see the biggest difference between tested configurations.
A configuration that does well in this test (delivering high connection rates) will handle situations with overwhelming connection rates much better, leaving more CPU resources available to workloads on the system.
1 Process
In this test, a single process opens as many TCP connections as possible in sequence:
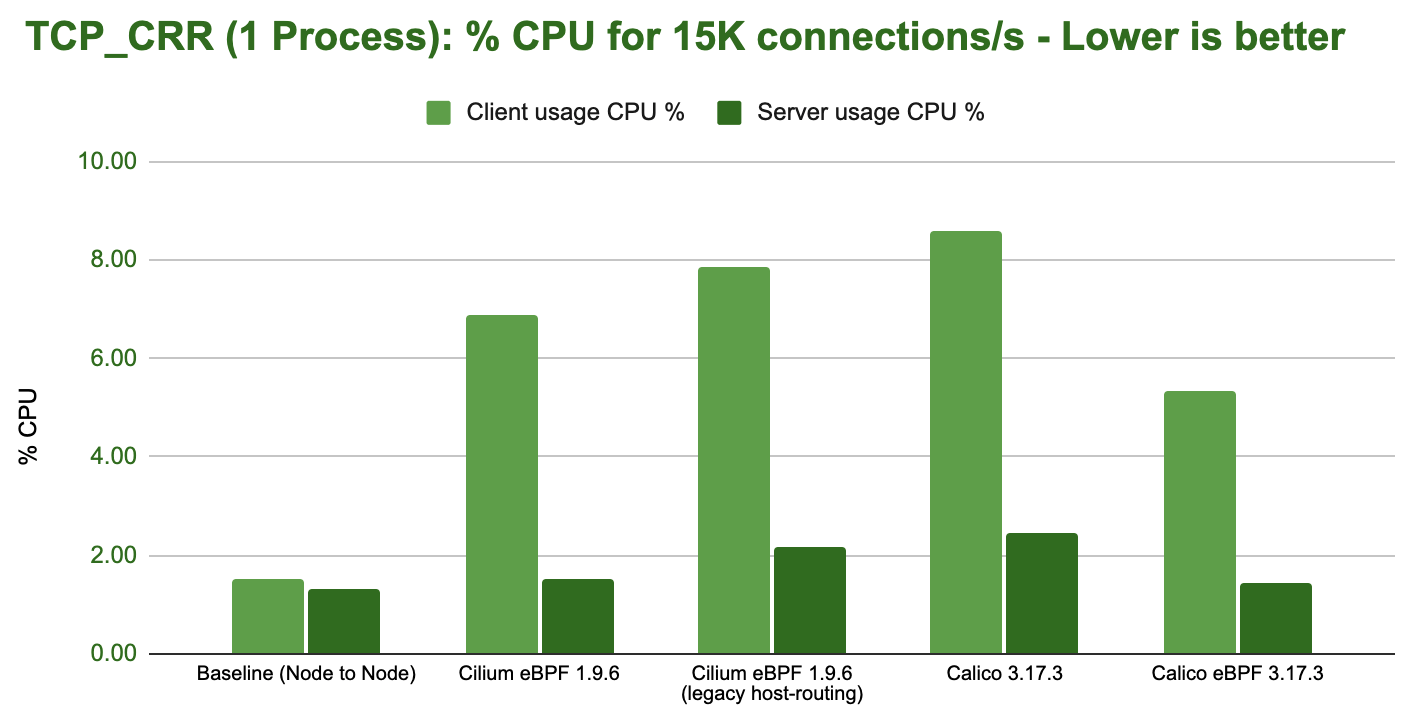
The following graph shows the total CPU consumption across the entire system while running the benchmark:
Tip
Kernel wisdom: The CPU resources graph makes it obvious that some additional kernel cost is paid at the sender as soon as network namespace isolation is performed as all container workload benchmarks show signs of this cost. We will investigate and optimize this aspect in a future release.
32 Processes
In this test, 32 processes running in parallel open as many TCP connections in sequence as possible. This is by far the most stressful test for the system.
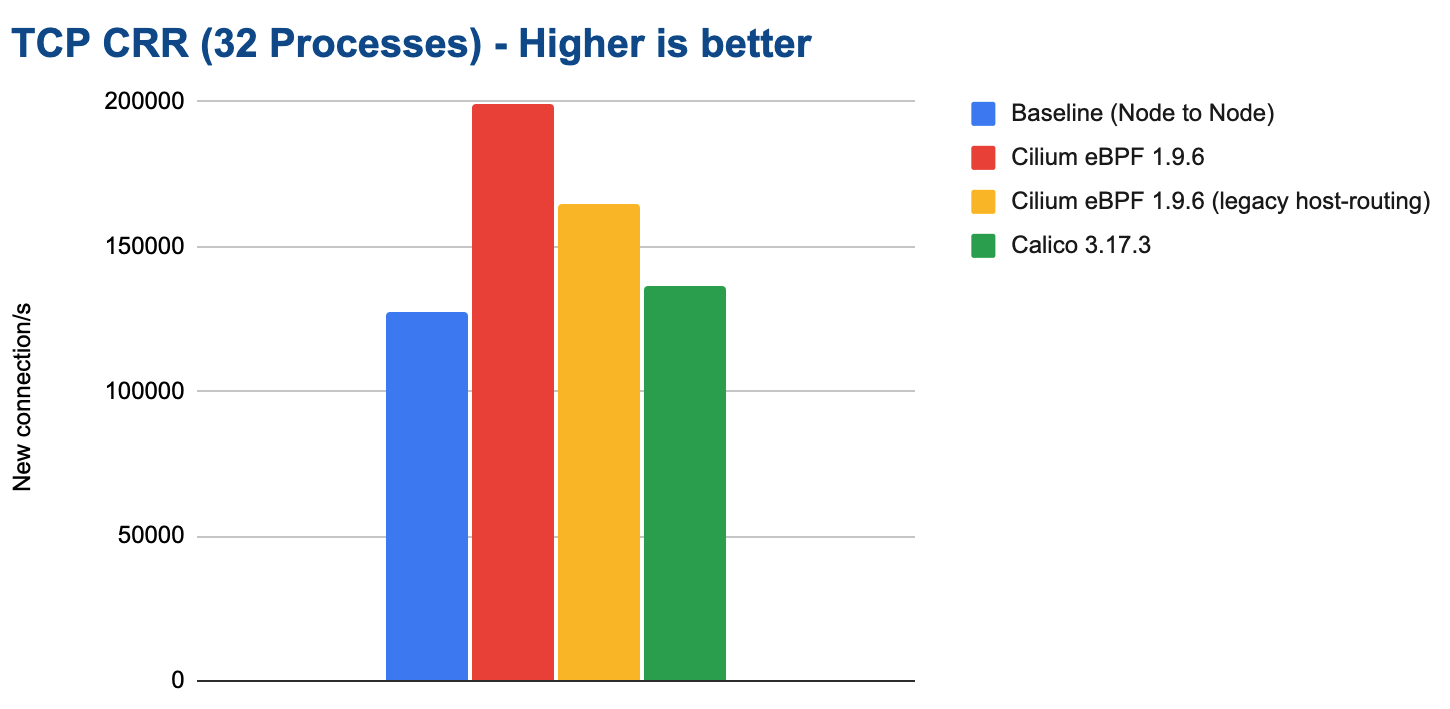
This benchmark outlines major differences between the tested configurations. In particular, it illustrates the overall cost of iptables which is optimized to perform most of the required work per connection and then caches the result. This leads to a worst-case performance scenario when a lot of new connections are expected.
Note
We have not been able to measure stable results for the Calico eBPF datapath. We are not sure why. The network packet flow was never steady. We have thus not included the result. We invite the Calico team to work with us to investigate this and then re-test.
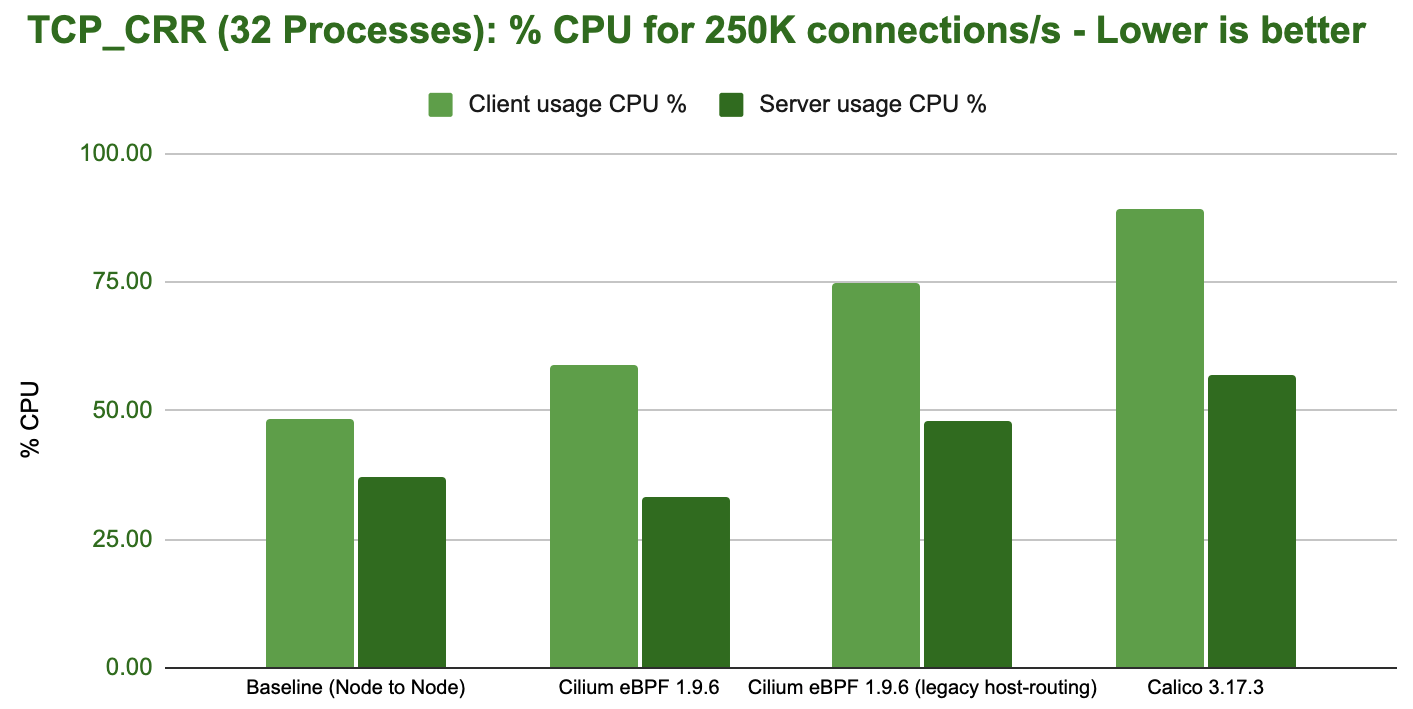
The following graph shows the total CPU consumption across the entire system while running the benchmark:
Encryption (WireGuard/IPsec)
Cilium supports encryption via WireGuard® and IPsec. This first section will look at WireGuard and compare it against using Calico for WireGuard encryption. If you are interested in IPsec performance and how it compares to WireGuard, please see WireGuard vs IPsec.
WireGuard Throughput
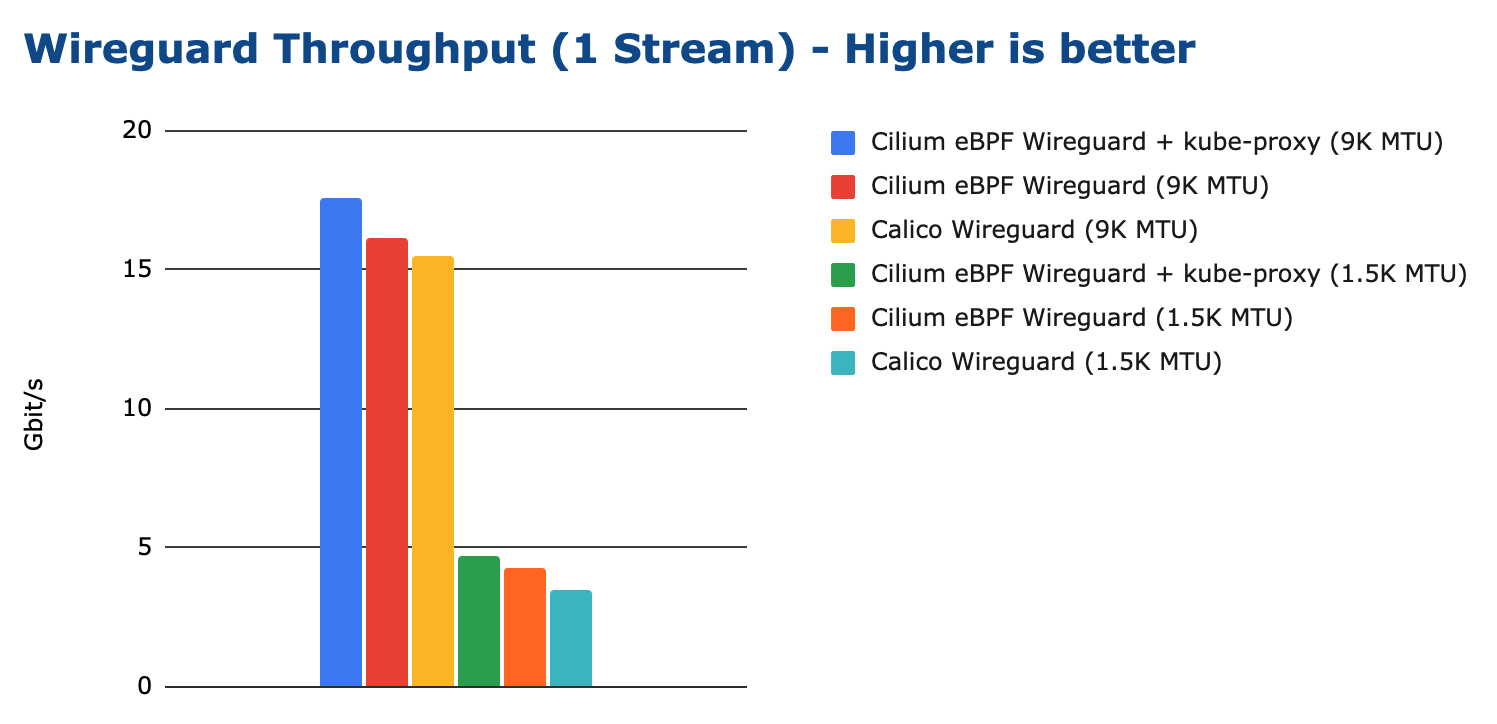
Looking at TCP throughput first, the following graph shows results for both 1500 bytes MTU and 9000 bytes MTU:
Note
The Cilium eBPF kube-proxy replacement combined with WireGuard is currently slightly slower than Cilium eBPF + kube-proxy. We have identified the problem and will be resolving this deficit in one of the next releases.
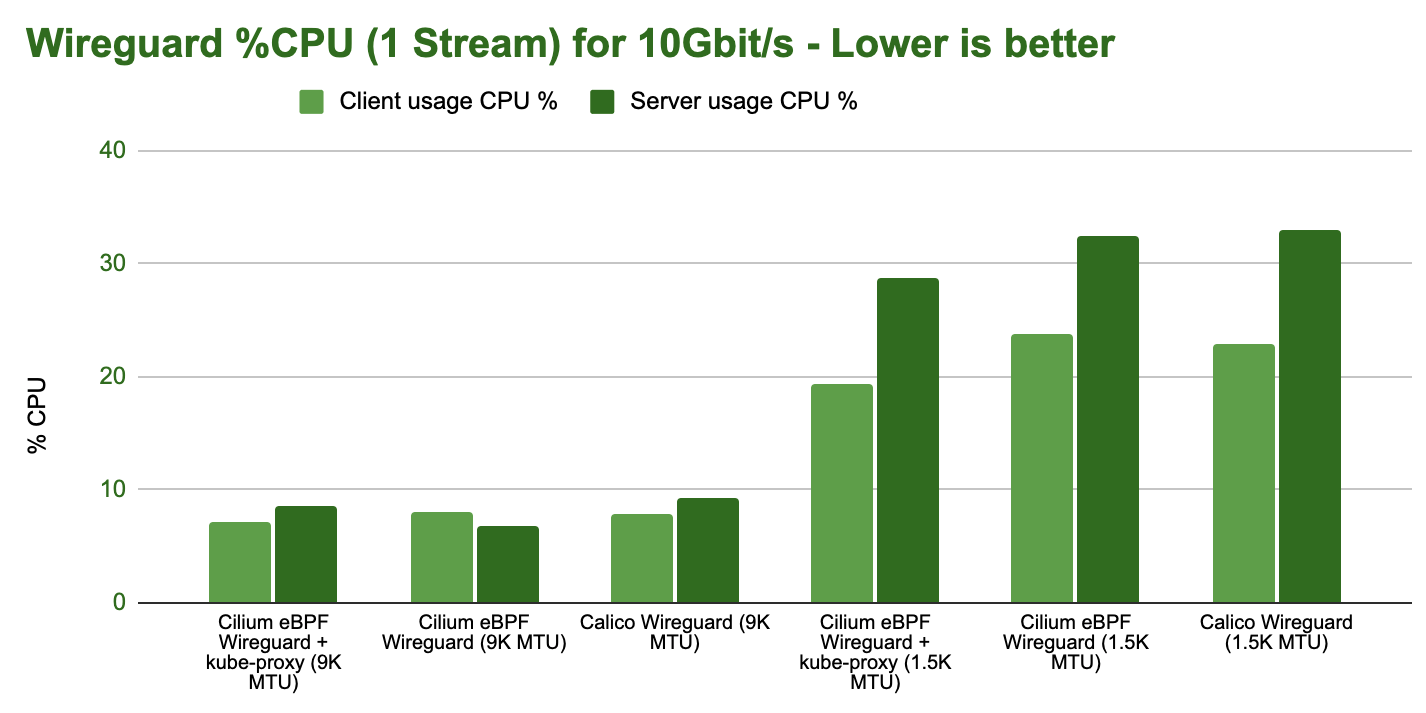
The following graph shows the total CPU consumption across the entire system while running the WireGuard encryption benchmark:
WireGuard Request/Response
The next benchmark measures the request/response rate while encrypting with WireGuard. See Request/Response Rate (TCP_RR) for details on what this test actually entails.
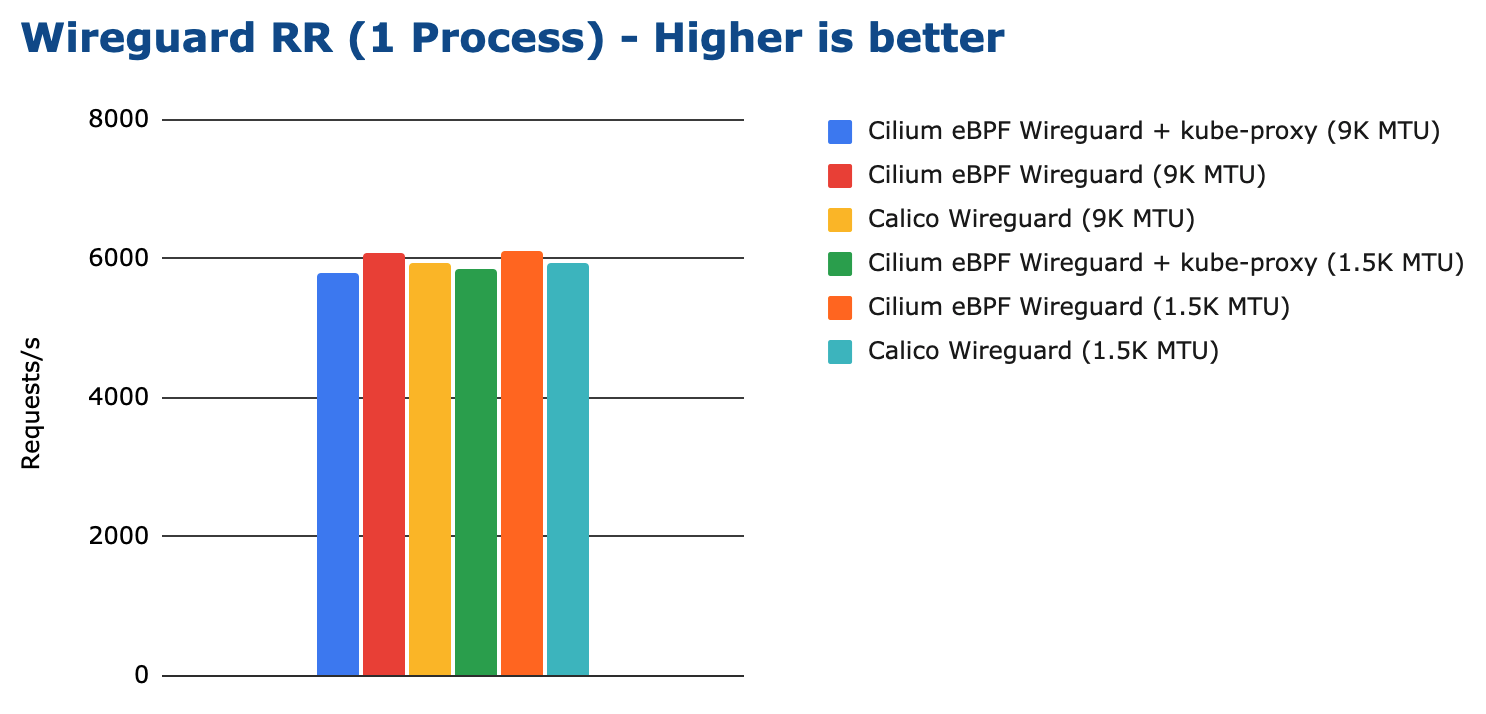
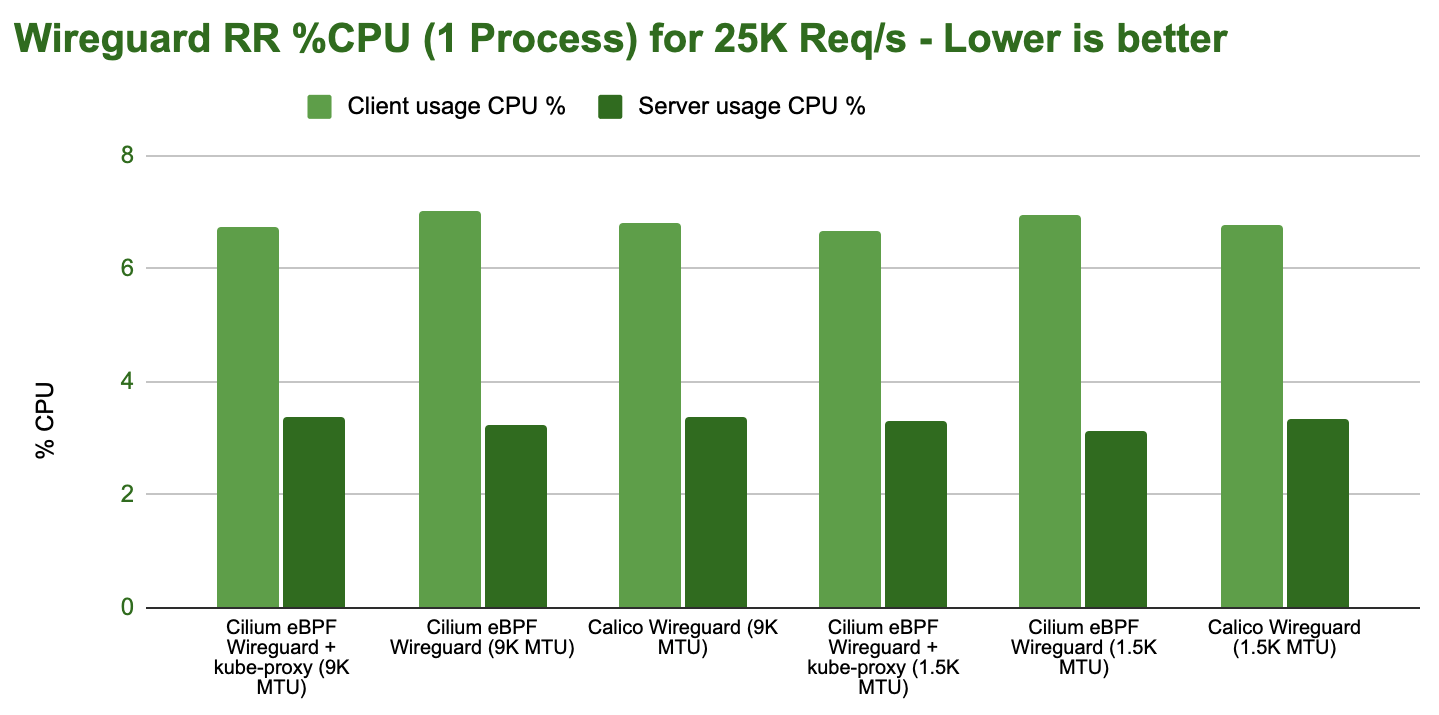
All tested configurations performed more or less the same. The following graph shows the total CPU consumption across the entire system while running the WireGuard encryption benchmark:
WireGuard vs IPsec
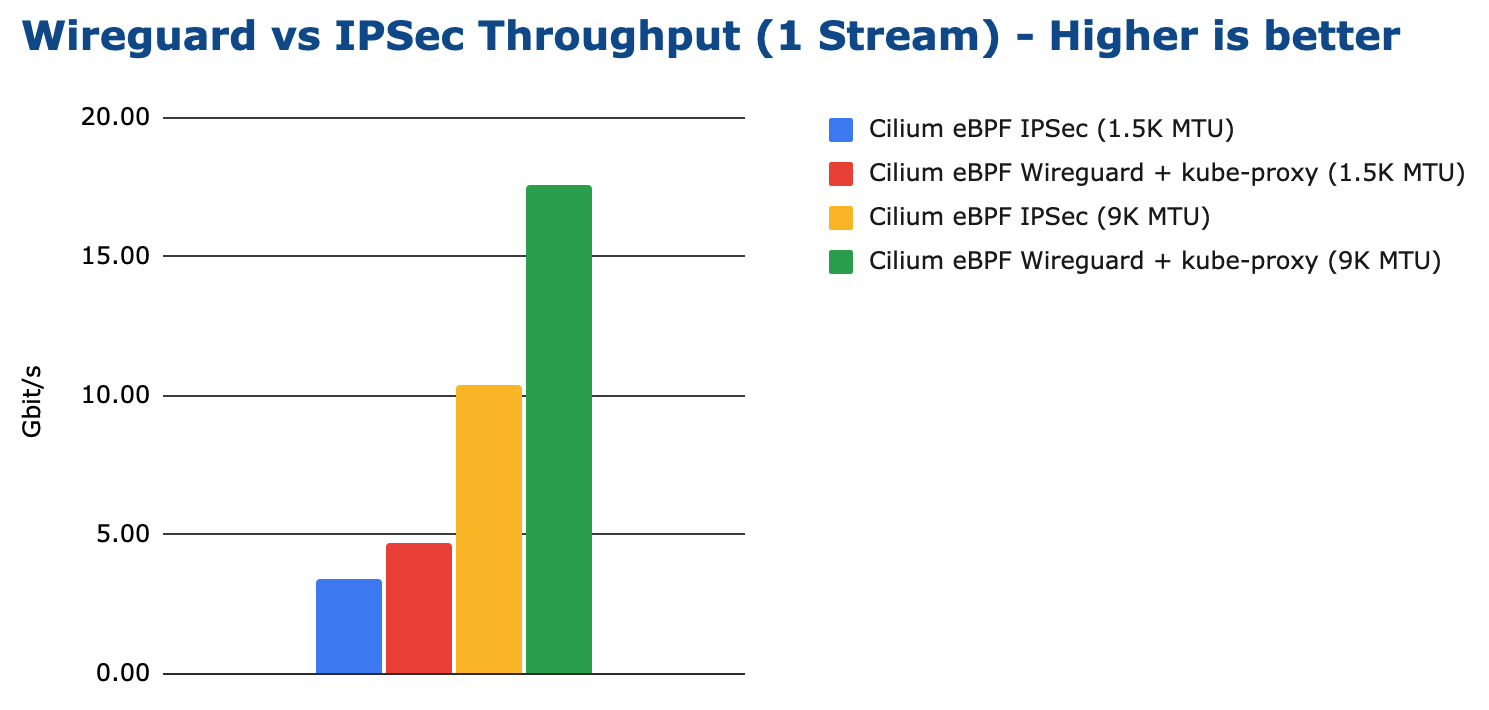
In this section, we compare Cilium encryption using WireGuard and IPsec. WireGuard is able to achieve a higher maximum throughput:
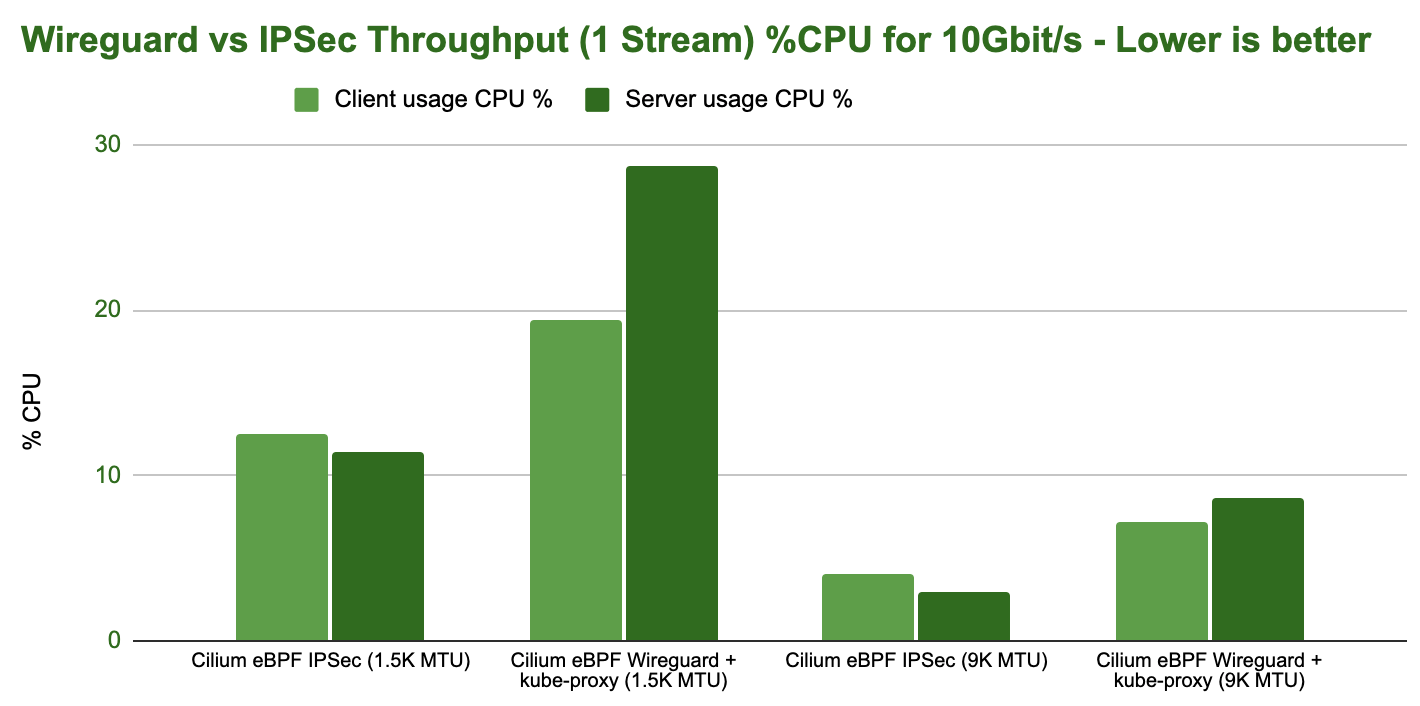
However, looking at the CPU resources required to achieve 10Gbit/s of throughput, WireGuard is less efficient at achieving the same throughput:
Tip
IPsec performing better than WireGuard in in this test is unexpected in some ways. A possible explanation is that the IPsec encryption is making use of AES-NI instructions whereas the WireGuard implementation is not. This would typically lead to IPsec being more efficient when AES-NI offload is available and WireGuard being more efficient if the instruction set is not available.
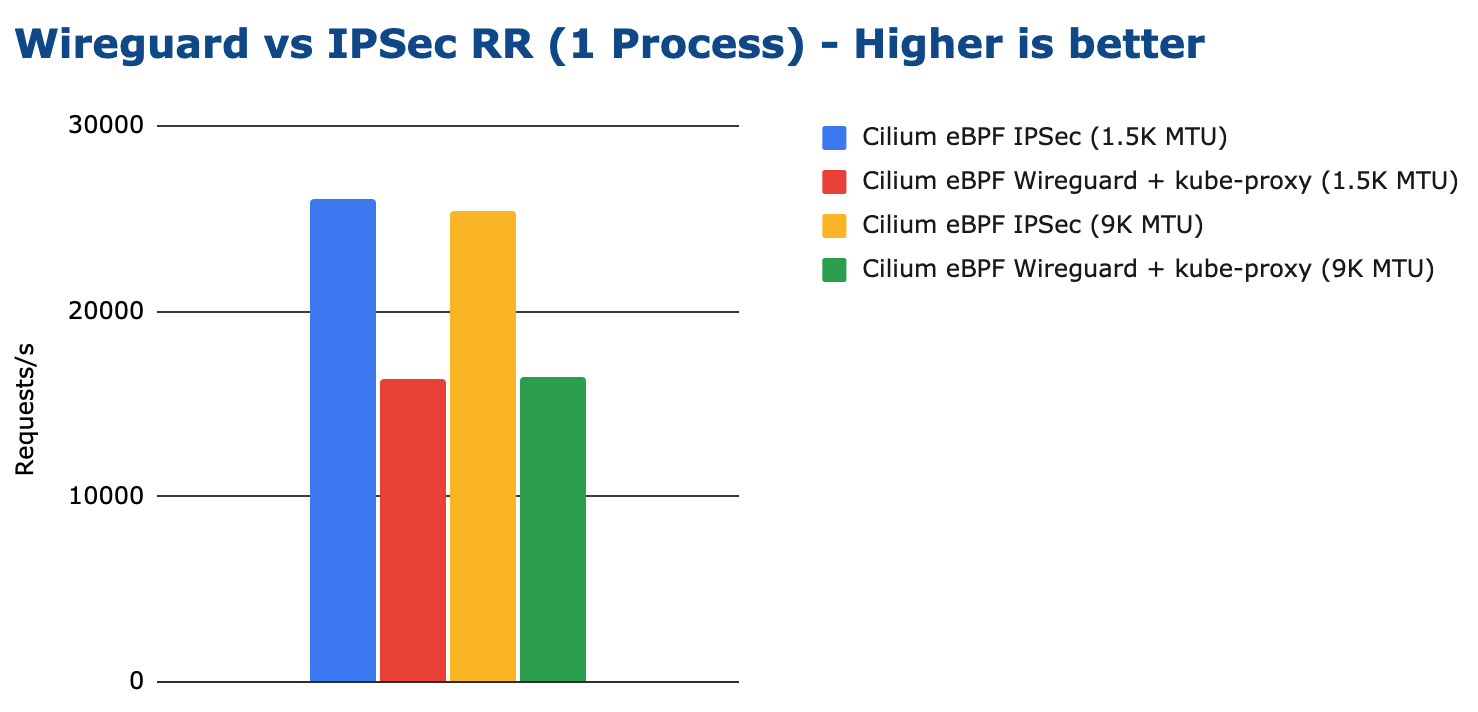
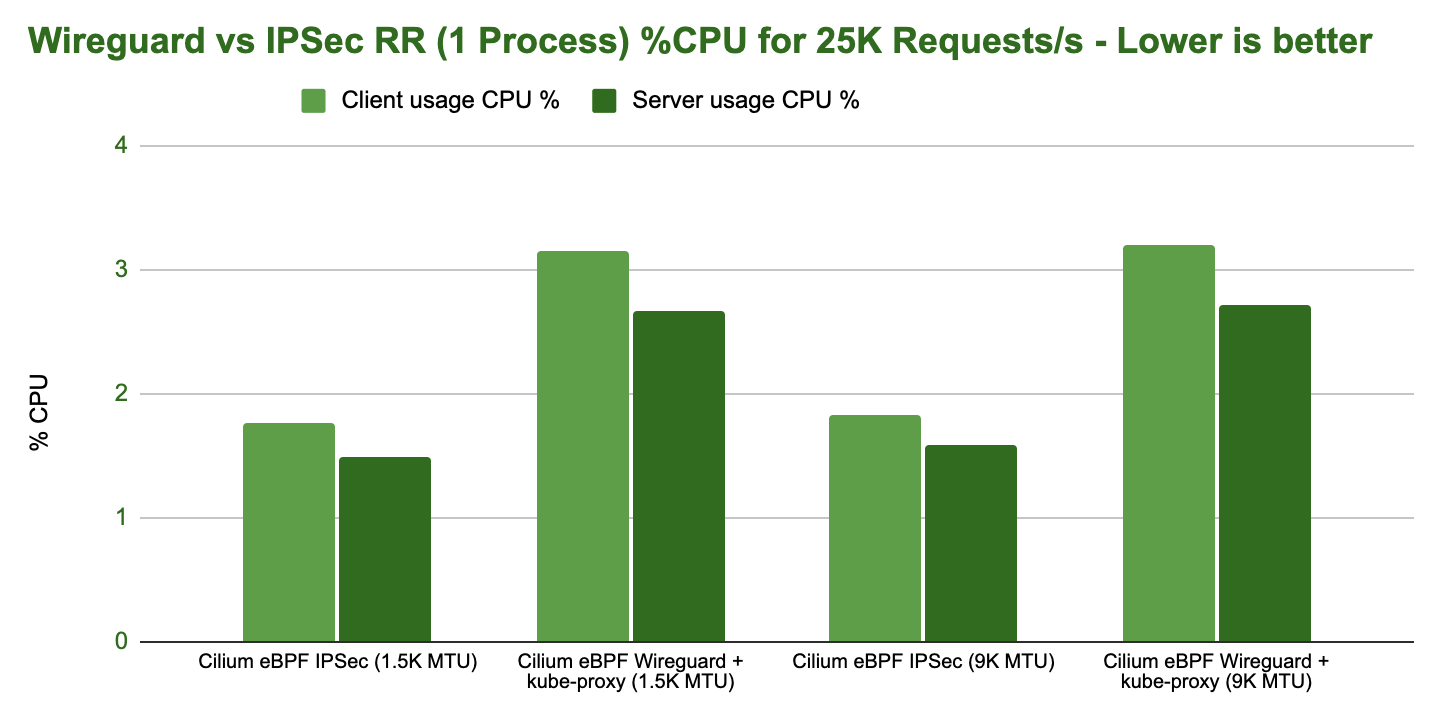
Looking at the request/response rate, IPsec is outperforming WireGuard in our tests. Unlike for the throughput tests, the MTU does not have any effect as the packet sizes remain small:
Test Environment
Test Hardware
All tests are performed using regular off-the-shelf hardware.
Item |
Description |
|---|---|
CPU |
AMD Ryzen 9 3950x, AM4 platform, 3.5GHz, 16 cores / 32 threads |
Mainboard |
x570 Aorus Master, PCIe 4.0 x16 support |
Memory |
HyperX Fury DDR4-3200 128GB, XMP clocked to 3.2GHz |
Network Card |
Intel E810-CQDA2, dual port, 100Gbit/s per port, PCIe 4.0 x16 |
Kernel |
Linux 5.10 LTS, see also Tuning Guide |
Test Configurations
All tests are performed using standardized configuration. Upon popular request, we have included measurements for Calico for direct comparison.
Configuration Name |
Description |
|---|---|
Baseline (Node to Node) |
No Kubernetes |
Cilium |
Cilium 1.9.6, eBPF host-routing, kube-proxy replacement, No CT |
Cilium (legacy host-routing) |
Cilium 1.9.6, legacy host-routing, kube-proxy replacement, No CT |
Calico |
Calico 3.17.3, kube-proxy |
Calico eBPF |
Calico 3.17.3, eBPF datapath, No CT |
How to reproduce
To ease reproducibility, this report is paired with a set of scripts that can be found in cilium/cilium-perf-networking. All scripts in this document refer to this repository. Specifically, we use Terraform and Ansible to setup the environment and execute benchmarks. We use Packet bare metal servers as our hardware platform, but the guide is structured so that it can be easily adapted to other environments.
Download the Cilium performance evaluation scripts:
$ git clone https://github.com/cilium/cilium-perf-networking.git
$ cd cilium-perf-networking
Packet Servers
To evaluate both Encapsulation and Native-Routing, we configure the Packet machines to use a “Mixed/Hybrid” network mode, where the secondary interfaces of the machines share a flat L2 network. While this can be done on the Packet web UI, we include appropriate Terraform (version 0.13) files to automate this process.
$ cd terraform
$ terraform init
$ terraform apply -var 'packet_token=API_TOKEN' -var 'packet_project_id=PROJECT_ID'
$ terraform output ansible_inventory  | tee ../packet-hosts.ini
$ cd ../
The above will provision two servers named knb-0 and knb-1 of type
c3.small.x86 and configure them to use a “Mixed/Hybrid” network mode under a
common VLAN named knb. The machines will be provisioned with an
ubuntu_20_04 OS. We also create a packet-hosts.ini file to use as an
inventory file for Ansible.
Verify that the servers are successfully provisioned by executing an ad-hoc uptime
command on the servers.
$ cat packet-hosts.ini
[master]
136.144.55.223 ansible_python_interpreter=python3 ansible_user=root prv_ip=10.67.33.131 node_ip=10.33.33.10 master=knb-0
[nodes]
136.144.55.225 ansible_python_interpreter=python3 ansible_user=root prv_ip=10.67.33.133 node_ip=10.33.33.11
$ ansible -i packet-hosts.ini all -m shell -a 'uptime'
136.144.55.223 | CHANGED | rc=0 >>
09:31:43 up 33 min,  1 user,  load average: 0.00, 0.00, 0.00
136.144.55.225 | CHANGED | rc=0 >>
  09:31:44 up 33 min,  1 user,  load average: 0.00, 0.00, 0.00
Next, we use the packet-disbond.yaml playbook to configure the network
interfaces of the machines. This will destroy the bond0 interface and
configure the first physical interface with the public and private IPs
(prv_ip) and the second with the node IP (node_ip) that will be used
for our evaluations (see Packet documentation and our
scripts for more info).
$ ansible-playbook -i packet-hosts.ini playbooks/packet-disbond.yaml
Note
For hardware platforms other than Packet, users need to provide their own
inventory file (packet-hosts.ini) and follow the subsequent steps.
Install Required Software
Install netperf (used for raw host-to-host measurements):
$ ansible-playbook -i packet-hosts.ini playbooks/install-misc.yaml
Install kubeadm and its dependencies:
$ ansible-playbook -i packet-hosts.ini playbooks/install-kubeadm.yaml
We use kubenetbench to execute the netperf benchmark in a Kubernetes environment. kubenetbench is a Kubernetes benchmarking project that is agnostic to the CNI or networking plugin that the cluster is deployed with. In this report we focus on pod-to-pod communication between different nodes. To install kubenetbench:
$ ansible-playbook -i packet-hosts.ini playbooks/install-kubenetbench.yaml
Running Benchmarks
Tunneling
Configure Cilium in tunneling (Encapsulation) mode:
$ ansible-playbook -e mode=tunneling -i packet-hosts.ini playbooks/install-k8s-cilium.yaml
$ ansible-playbook -e conf=vxlan -i packet-hosts.ini playbooks/run-kubenetbench.yaml
The first command configures Cilium to use tunneling (-e mode=tunneling),
which by default uses the VXLAN overlay. The second executes our benchmark
suite (the conf variable is used to identify this benchmark run). Once
execution is done, a results directory will be copied back in a folder named
after the conf variable (in this case, vxlan). This directory includes
all the benchmark results as generated by kubenetbench, including netperf output
and system information.
Native Routing
We repeat the same operation as before, but configure Cilium to use
Native-Routing (-e mode=directrouting).
$ ansible-playbook -e mode=directrouting -i packet-hosts.ini playbooks/install-k8s-cilium.yaml
$ ansible-playbook -e conf=routing -i packet-hosts.ini playbooks/run-kubenetbench.yaml
Encryption
To use encryption with native routing:
$ ansible-playbook -e kubeproxyfree=disabled -e mode=directrouting -e encryption=yes -i packet-hosts.ini playbooks/install-k8s-cilium.yaml
$ ansible-playbook -e conf=encryption-routing -i packet-hosts.ini playbooks/run-kubenetbench.yaml
Baseline
To have a point of reference for our results, we execute the same benchmarks between hosts without Kubernetes running. This provides an effective upper limit to the performance achieved by Cilium.
$ ansible-playbook -i packet-hosts.ini playbooks/reset-kubeadm.yaml
$ ansible-playbook -i packet-hosts.ini playbooks/run-rawnetperf.yaml
The first command removes Kubernetes and reboots the machines to ensure that there are no residues in the systems, whereas the second executes the same set of benchmarks between hosts. An alternative would be to run the raw benchmark before setting up Cilium, in which case one would only need the second command.
Cleanup
When done with benchmarking, the allocated Packet resources can be released with:
$ cd terraform && terraform destroy -var 'packet_token=API_TOKEN' -var 'packet_project_id=PROJECT_ID'